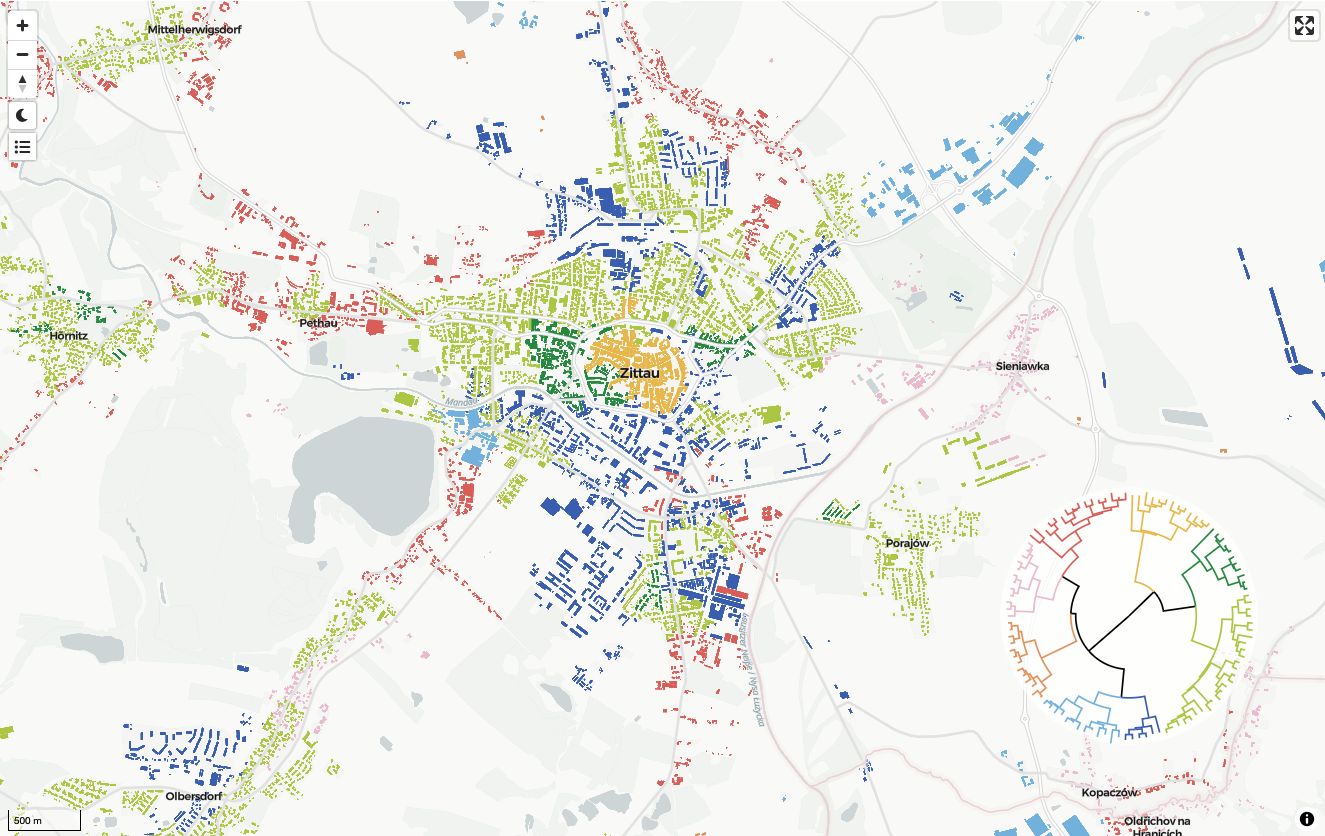
Map of Urban Taxonomy
An interactive exploration of the taxonomy at the level of individual buildings.
How to work with the map?
The map supports interactivity beyond panning and zooming.
Taxonomy details
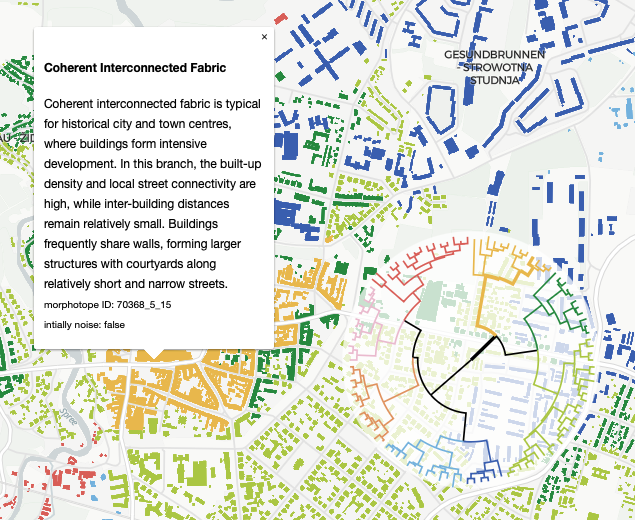
When you click on a building on the map, two things happen. First, you will see a popup with information about the branch (at level 3) that the building belongs to, including a short description. Second, the diagram showcasing the structure of the taxonomy in the bottom-right corner will highlight the specific branch (up to level 7) that the building belongs to.
Taxonomy filtering
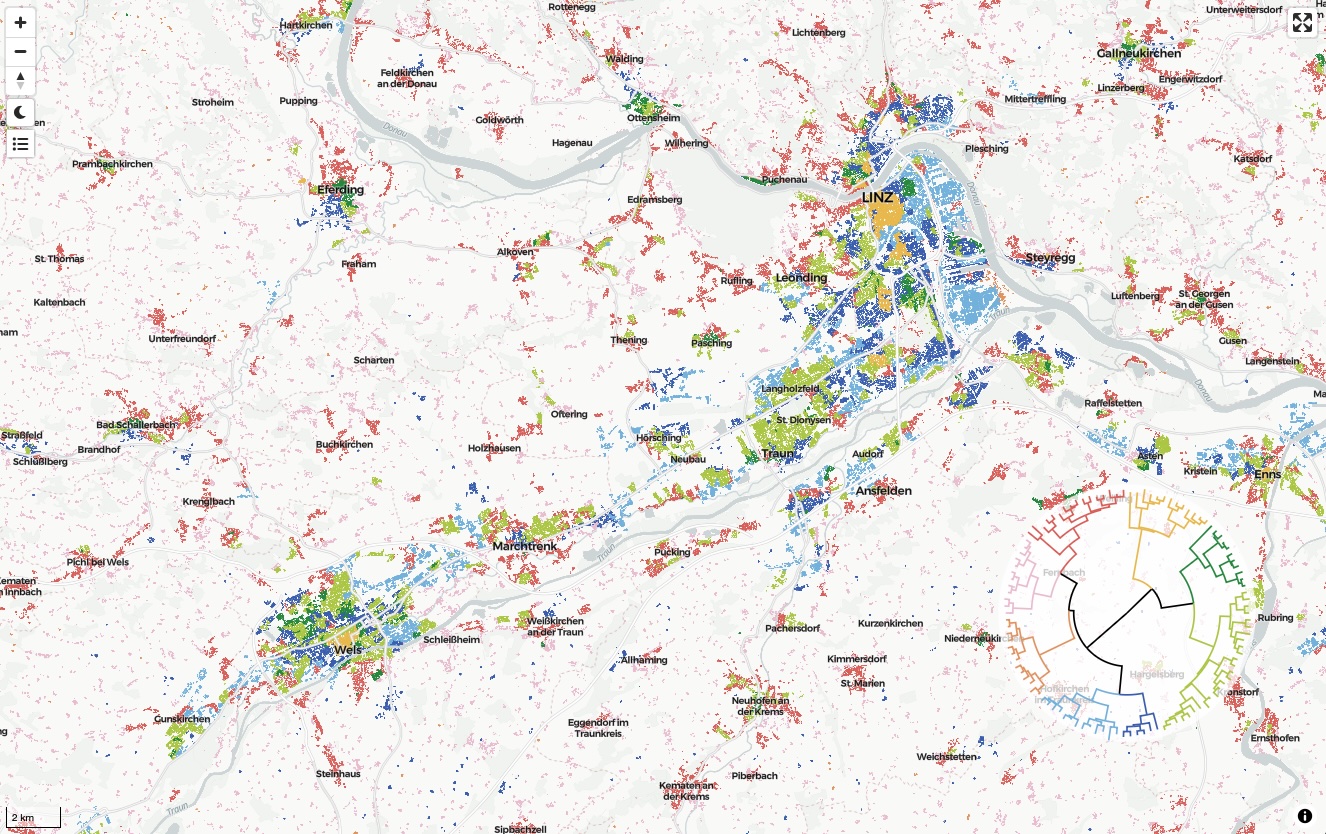
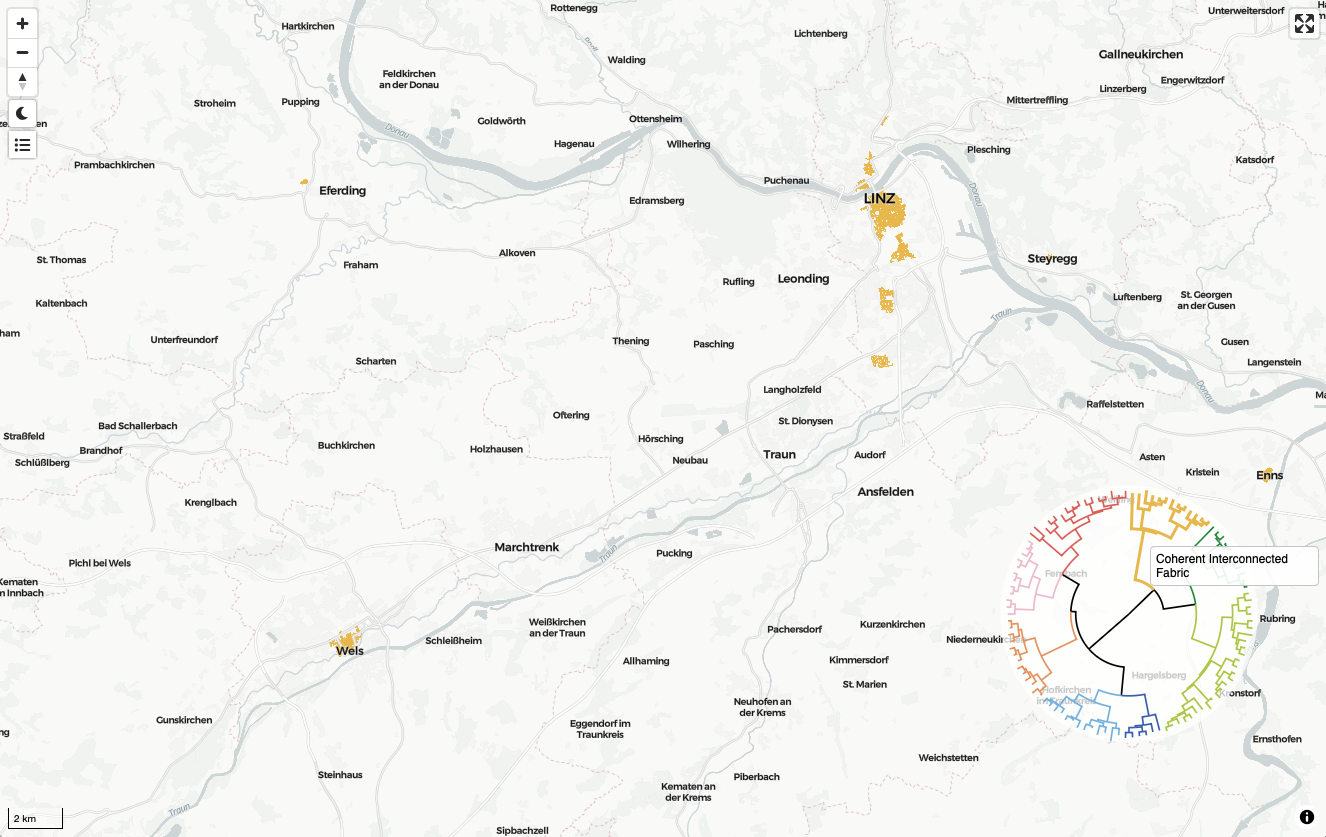
The taxonomy diagram in the bottom-right corner can also be used to filter the map. When you click a branch at a chosen level, the map will filter to show only the contents of that branch.
Legend
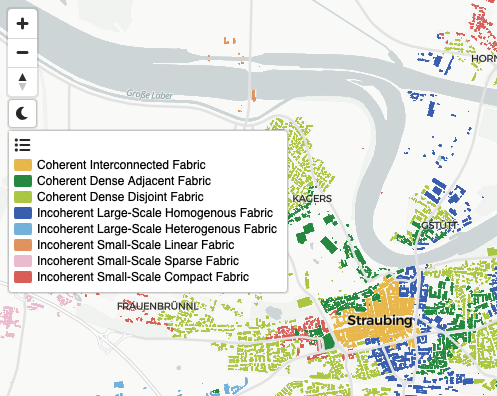
In addition to the tree diagram and the popup, the names of individual branches shown on the map are available in the collapsible legend in the left control centre.
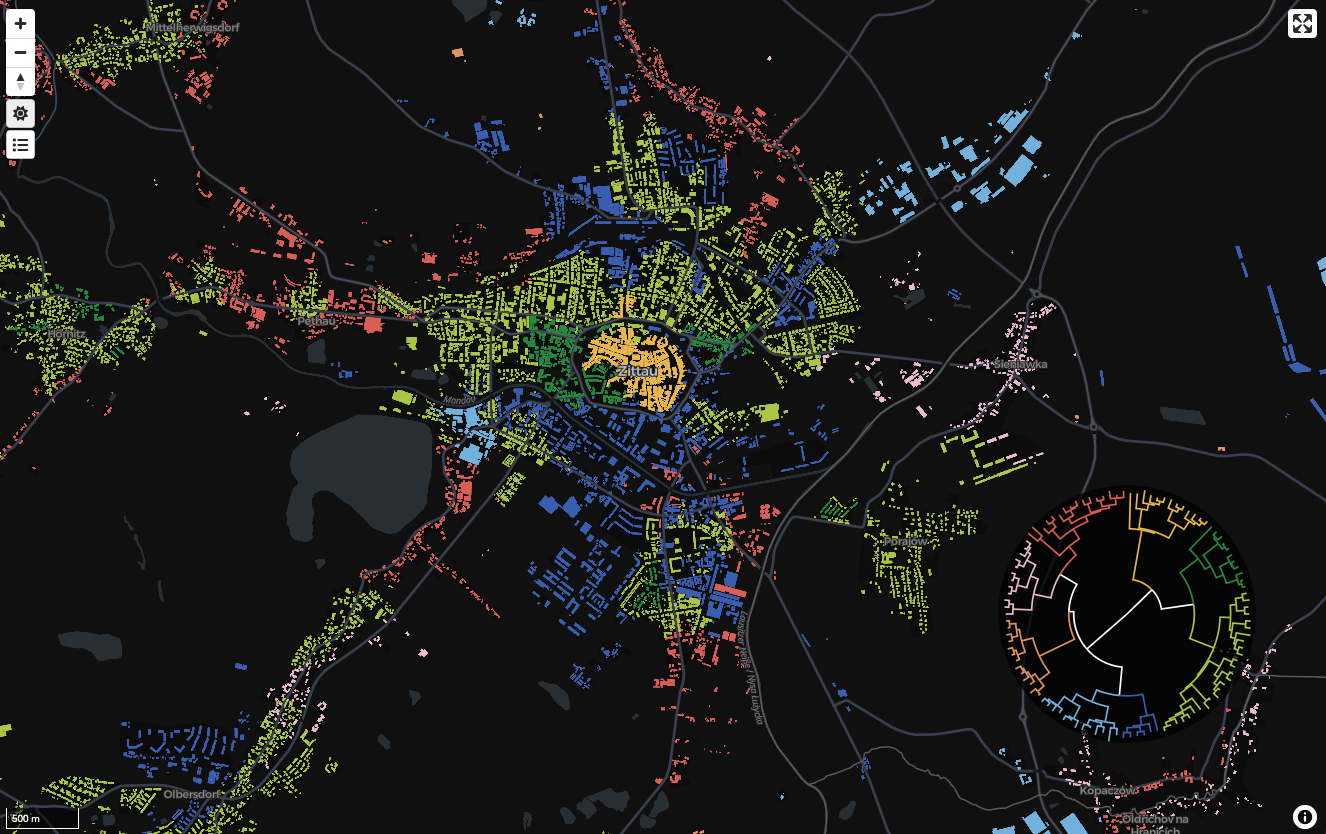
Dark mode
If you prefer to explore the map in dark mode, you can toggle it on in the control centre. We recommend using dark mode when viewing a large-scale overview of large regions, as small, scattered development is typically more visible thanks to the higher contrast.
Fullscreen
You can open the map in fullscreen using the button in the top-right corner. Clicking it again will close it.
See the documentation for more details and get the data.